Metro Bikeshare Data

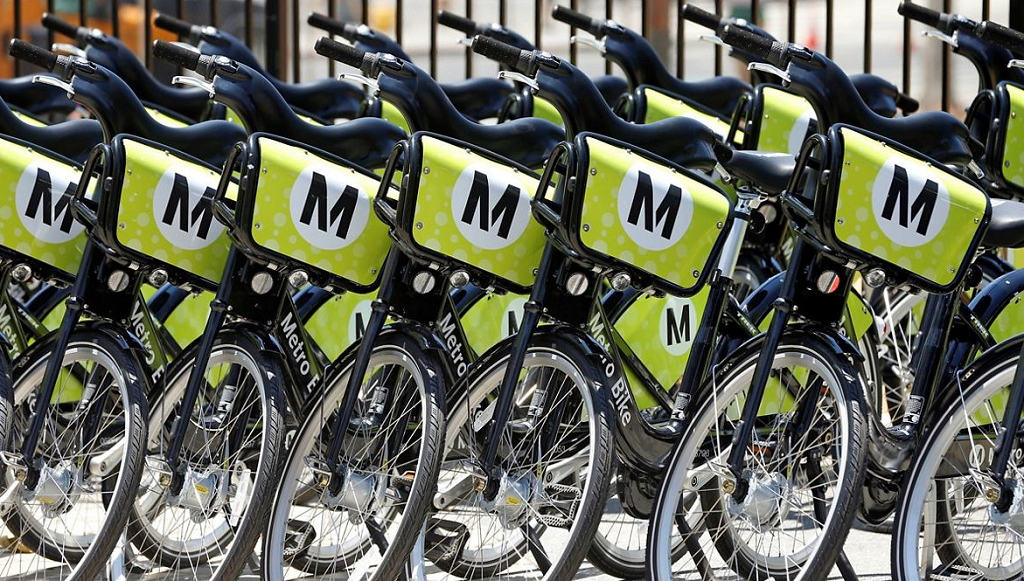
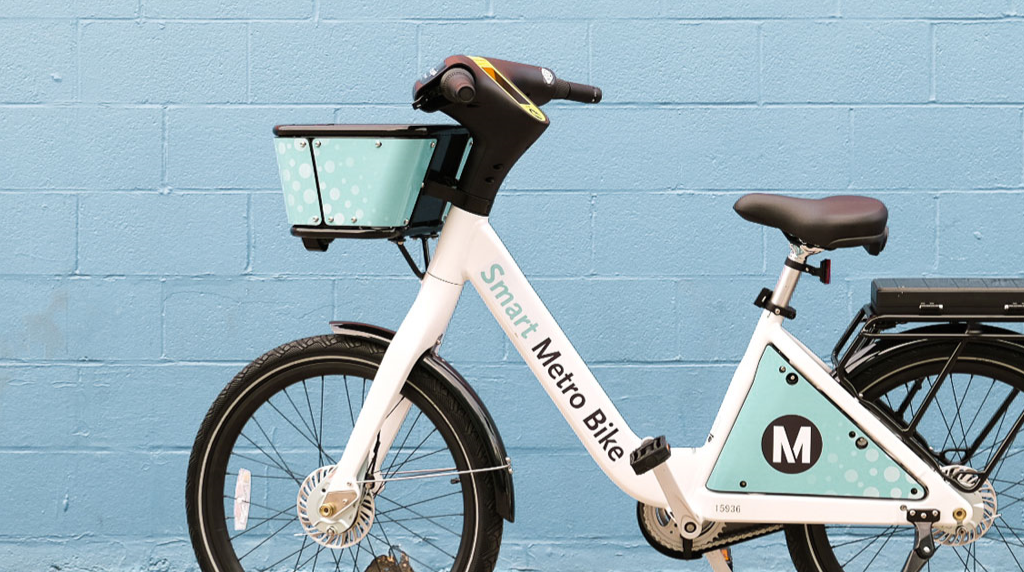
I've always loved biking, so I was ecstatic to get a free annual Metro Bikeshare pass this last spring. For an explanation of the system, here's an exerpt is from the metro bikeshare website:
The Metro Bike Share system makes bikes available 24/7, 365 days a year in Downtown LA, Central LA, Hollywood, North Hollywood and on the Westside. Metro Bike Share offers convenient round-the-clock access to a fleet of bicycles for short trips. Metro Bike Share is one of LA Metro's multiple public transportation options for Angelenos and visitors to get around.
Metro Bike Share is a fast, easy, and fun way to ride, anytime. Get a bike from any Metro Bike Share station, go for a ride, and properly return it. It’s easy — just like riding a bike!
Since getting my membership, I've been able to bike to my classes, the grocery store, the gym, and more. It's faster than walking, I avoid traffic, and it's overall just fun! I've rarely had issues of crowded stations or empty stations at UCLA, and even if I did, there were always some nearby in Westwood.
It's immediately evident that Metro Bikeshare has experienced a surge in popularity over the past year. In 2021, the daily average rentals stood at around xx bikes, with a notable exception in September, where the numbers spiked to over 900 per day (maybe a promotional event?). However, since then, there has been a consistent increase, with an average of xxx bike rentals per day. An important factor to consider in this context is the continuous expansion of Metro Bikeshare stations. Notably, stations in Burbank were only introduced in January 2021, and the UCLA stations (which I use) were not available until January 2023. Even when I normalized each station by popularity, it's apparent how much more popular Metro Bikeshare has become recently. This leads us to the original question: In which regions does bikeshare demand outweigh others, and how should Metro Bikeshare respond to this evolving demand?
I have decided to normalize the number of bike rentals per station. And, for clarity, I've graphed the k/2 most popular routes among the k stations in the dataset. Hovering over a station (dot) in these visualizations includes the station number, name, and its average daily rental count. I'll put my code on my GitHub.
It's evident from this visual that the most frequented routes are concentrated along Santa Monica's shorefront, UCLA's campus, Culver City, USC's campus, and the downtown area of Los Angeles. Metro Bikeshare also categorizes these stations into three distinct regions: Santa Monica (region 2), Downtown Los Angeles (region 9), and North Hollywood + Burbank (region 1). We'll analyze these regions more closely below.
(Note: To access maps, please click around on the dropdown menus, I have no idea how to fix this.) When we narrow our focus to Region 2, the most frequented routes converge on the Downtown Santa Monica E Line station (station 4215) and Ocean Front Walk & Navy (station 4214), with both averaging 60 rentals per day. Given Santa Monica's status as a tourist hotspot, it's probable that most of these rentals are from visitors instead of commuters. Take for example station Dockweiler Beach (station 4544), while being at the southernmost point of the beach, still averages over 14 rentals a day. It's interesting to note that even though UCLA's stations were built relatively later (with some only 7 months ago), they're featured prominently in the dataset. It would be very beneficial to expand the station network in Westwood, particularly for students who may bike to class (like me!).
When we focus on regions 1 and 9, we observe a complex web of routes throughout downtown, with 7th & Flower (station 3005) standing out as the most popular, averaging 38 rentals per day. USC's also a popular hub, especially with its stations' vicinity to DTLA. Interestingly, North Hollywood isn't that popular. While it's true that these stations are relatively new, I thought that the fact that it's a touristy location would offset that.
When looking at the data by filtering for rental types, we get more cool results. Metro Bikeshare users have two primary options for renting a bike: they can either make an on-the-spot rental (walk-up) or use their TAP account with a membership (daily, monthly, or annual). Focusing on walk-up and daily pass rentals reveals a striking concentration in Santa Monica, particularly at stations 4214 and 4215, where nearly 75% of the daily rentals from these stations come from walk-up and day pass users. Given Santa Monica's touristy status, I think its safe to label these renters as visitors wanting to explore the Pier, beach, promenade, and more. And if these visitors are unable to find available stations along the beach, they seem to drop off their bikes a few blocks inland.
On the other hand, monthly and annual pass rentals are predominantly centered in downtown Los Angeles, USC, UCLA, and Culver City, suggesting a focus on commuting needs. However, it's worth noting that even the most popular station for annual pass rentals, Figueroa & 8th (station 3035), averages only around 4 rentals per day from annual pass holders. To look further into this, the following graph illustrates that a majority of bike rentals are from monthly pass holders who are responsible for most of the increased rentals over the past two years. It's reasonable to speculate that tourists typically opt for daily or walk-up rentals, and many new riders may be hesitant to commit to an annual pass upfront.
So far, all of my analysis has been on Metro Bikeshare's public, downloadable data. Which is great! But something I really wanted to look into was Metro's API, which gives realtime information on the number of bikes at each station.
With this API, along with various station attributes, such as working status and total bike capacity, I was able to map the average capacity of each station over the past 2.5 years.
It's not surprising to hear that station 4215 near the E-Line in Santa Monica is consistently full (this is the station that I couldn't return my bike to and had to bike down towards Dockweiler to return it!). One interesting observation is that two nearby stations, 4214 and 4219, are often found to be nearly empty. My assumption is that visitors rent bikes at stations near attractions or where they parked, and are reluctant to walk a significant distance to return it. So station 4215, being closest to the pier, is consistently full, while those farther inland are not. In contrast, when we zoom into Downtown Los Angeles (DTLA), for example, we notice that most stations maintain an average of around 50% capacity. This is likely because DTLA stations are always within a few blocks of each other, so riders can easily find another station. This convenience is definitely preferred over areas like Venice and Santa Monica, where the stations are more dispersed, making it less practical for users to find an alternative nearby station.
With all of this in mind, here are some reccomendations for improving the Metro Bikeshare system:
- Given the heavy reliance on the E-Line bike station in Downtown Santa Monica, it would be beneficial to build more stations in this area. Potential areas include along Wilshire, Ocean Ave., and Broadway. Notably, Ocean Front Walk, due to its constant foot traffic, could be an ideal spot. Furthermore, given the consistent popularity of bike routes from Santa Monica to Dockweiler Beach, having more stations along the beach, especially farther north on PCH, would cater to the year-round demand.
- Considering that nearly 75% of rides in Santa Monica are through walk-up rentals and day passes, increasing the availability of stations or increasing promotional efforts for Metro Bikeshare could be very beneficial. Conversely, in areas like downtown Los Angeles, USC, UCLA, and Culver City, where well-established stations predominantly are used by riders with monthly and annual passes, Metro Bikeshare should promote annual passes more for easier commuting.
- Westwood, Sawtelle and West Hollywood would definitely benefit from new Metro bike stations, especially after seeing how popular UCLA's stations have become in seven months alone. It would also make my commute a lot easier :)
This was a fun project to work on, and I'm more confident with Python and Plotly to create the visuals that I need. More importantly, I really enjoy using Metro Bikeshare, so discovering that their rental data and API are public was incredible. I encountered some of the difficulties with renting bikes at UCLA and Santa Monica firsthand, and the data helped me identify areas for improvement. It's also exciting to note how popular Metro Bikeshare has become in recent months, and I look forward to seeing how my visuals will evolve as I incorporate new quarterly data.

