Live Metro Bike Availability Map
As an extenion of my Metro Bike Share analysis project, I built a live availability map.
In addition to publishing their quarterly data, Metro Bike Share has live station data available for use.
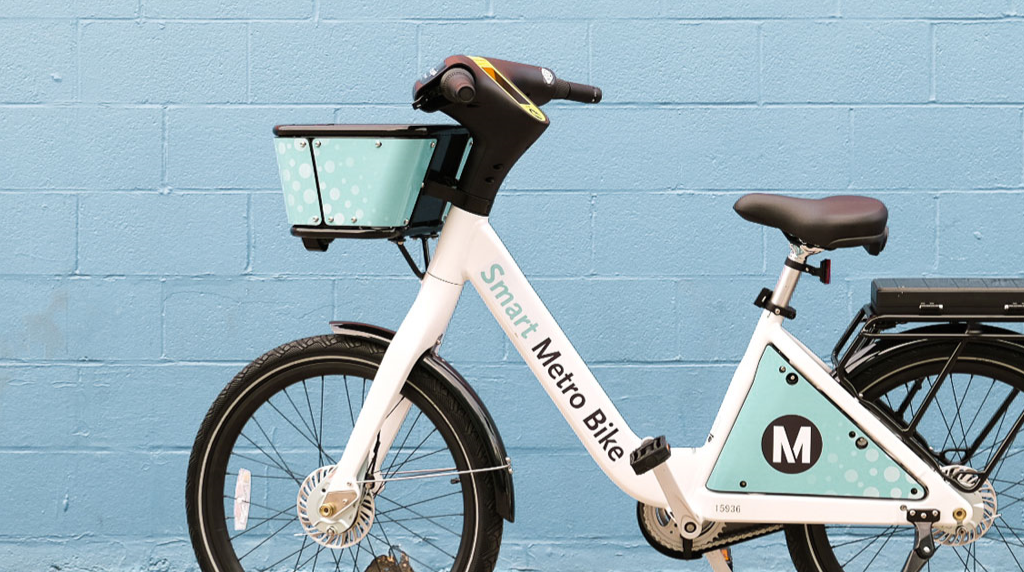
Clicking on a station gives information on the station name, location, number of available bikes, and station capacity. Stations with green borders have electric bikes. The data is updated every 60 seconds.
This project was initially developed using Folium, a Python library utilized for visualizing geospatial data. Then, I integrated the Realtime plugin for Folium, leveraging the open-source JavaScript library Leaflet.js. The Realtime plugin, which requires JavaScript, executes the script at predefined intervals. This plugin was developed only 20 days prior to the project's date, and I found it extremely helpful, particularly after encountering challenges with creating live interactive maps using Plotly during my previous report analysis in November.