Bike Rental Model

This data set of interest is of Capital Bikeshare rentals in 2011 and 2012, sourced from the UCI Machine Learning Repository. From the site:
“Bike-sharing systems represent a new generation of traditional bike rentals, where the entire process - from membership and rental to return - has become automatic. With these systems, users can easily rent a bike from a particular location and return it to another. Currently, there are over 500 bike-sharing programs worldwide, which comprise more than 500,000 bicycles. These systems are of great interest due to their important role in addressing traffic, environmental, and health issues.
In addition to the interesting real-world applications of bike-sharing systems, the characteristics of the data generated by these systems make them attractive for research. Unlike other transport services such as buses or subways, the duration of travel, departure, and arrival positions are explicitly recorded in these systems. This feature turns bike-sharing systems into a virtual sensor network that can be used for sensing mobility in the city. Therefore, it is expected that most of the important events in the city could be detected by monitoring this data.”
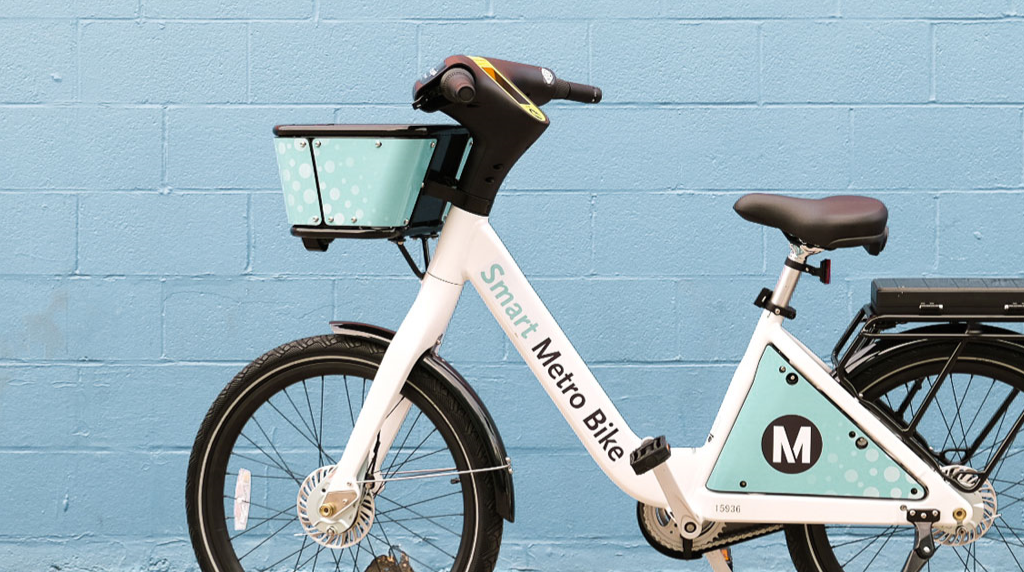
I was able to get a free year of Metro bikes through UCLA, and while this data is of D.C. rentals, I thought that modeling rental trends would be interesting. With the final model:
Perceived temperature has the greatest influence on number of bikes rented: when we ran our regression subsets test, it was the very first variable chosen. A 1 degree (F) increase in the temperature correspond to 5,596 bikes rented!
Number of rented bikes also depends a fair amount on the day of the week: the farther into the week, the more predicted bikes rented. The greatest negative influences on rental count are rain (weathersit3), high windspeed, high humidity, and holidays. These all make sense. In all, 79% of the variation in total rented bike counts can be attributed to these variables. We can see that from our regressions subset test that a model with just the date, weather situation and temperature serves well enough, but if we have access to all of these variables, we might as well use them.
This project can prove helpful for cities that want to adopt a rental bike system and help plan accordingly for total number of stations and bikes needed. The D.C. bike company could also vary prices based on these variables to maximize profits or maximize number of bikes used for certain days or periods.
This model only predicts total number of bikes rented per day. Future analysis on hourly rental counts or location-based rental information could be interesting. It would also be interesting to create models for casual rentals and registered rentals. We assumed that there was no difference in rental preferences for the sake of this project.
The complete report can be found here!

